




AWS pricing dashboard
1.0
 Extension » pandorafms.aws.pricing.dashboard
Last update: 2026-11-03 17:02:30

Description
The AWS Pricing Dashboard is a Pandora FMS console extension that presents the catalog prices and account costs produced by the AWS Pricing Discovery plugin in a single view. It aggregates the price points and the Cost Explorer figures already stored in the console into summary cards, charts and tables. It reads the agents and modules created by the plugin and does not collect data on its own.
Images
Additional information
The extension adds an AWS Pricing entry to the console status menu, available to users with agent read or reporting read permission, or administrator access. It detects the agents created by the AWS Pricing Discovery plugin through the marker the plugin writes, not through their display names, and reads the latest values and states of their modules. Agents discovered with plugin 1.0 are also recognized through their module markers.
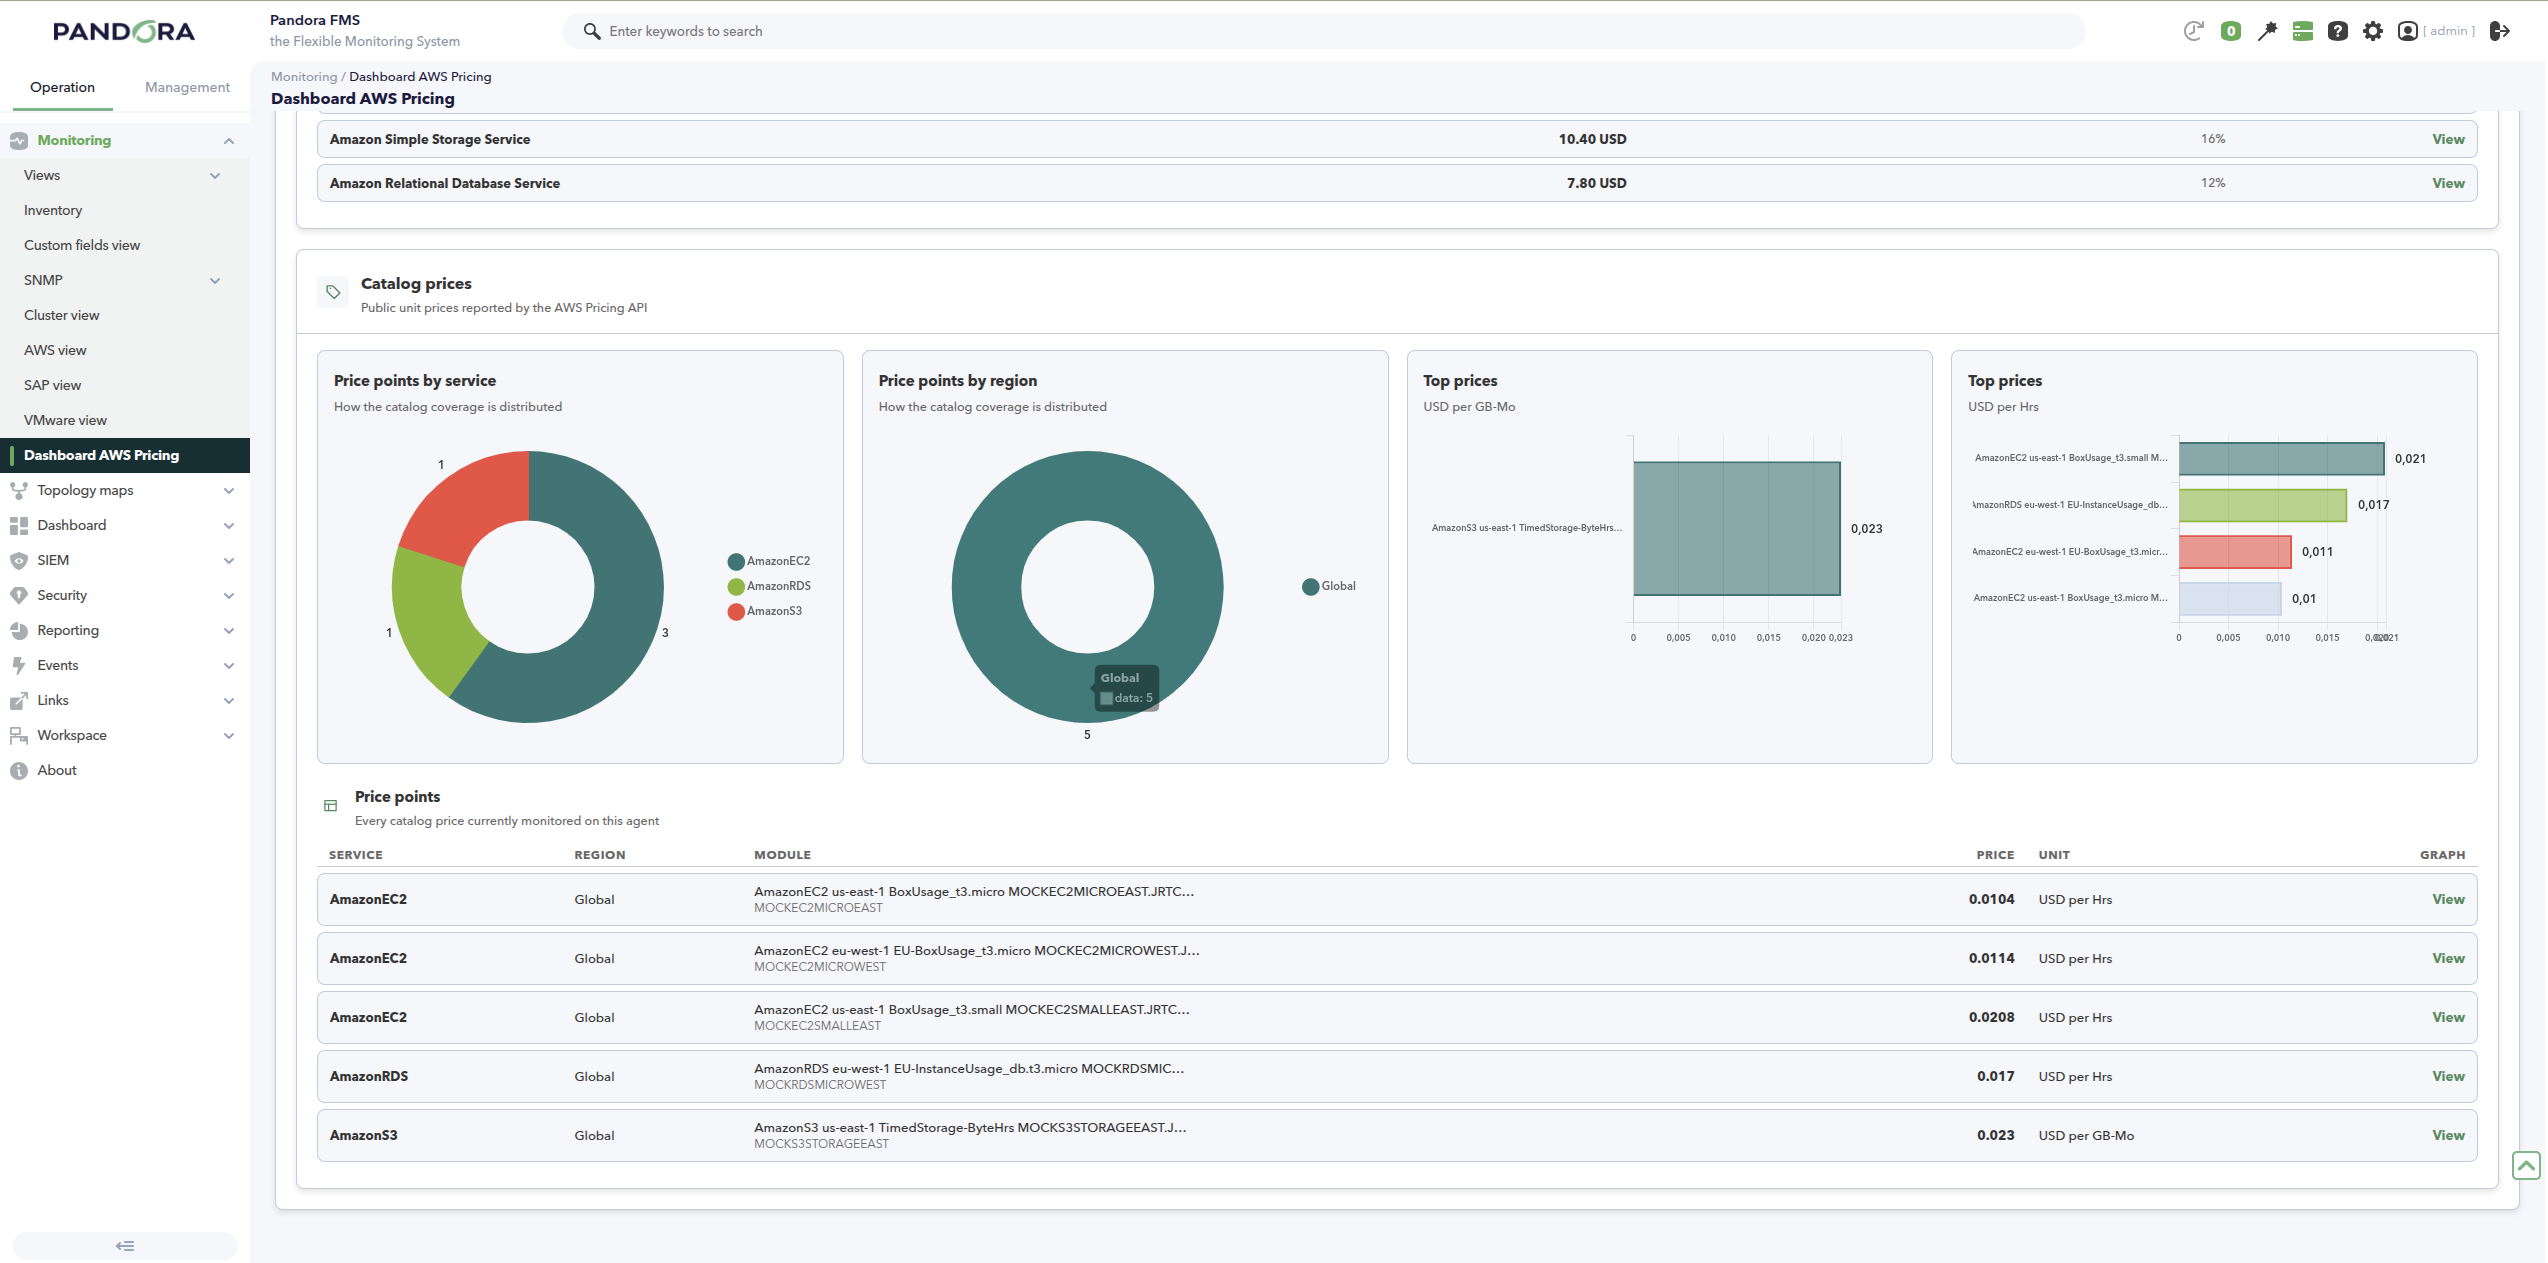
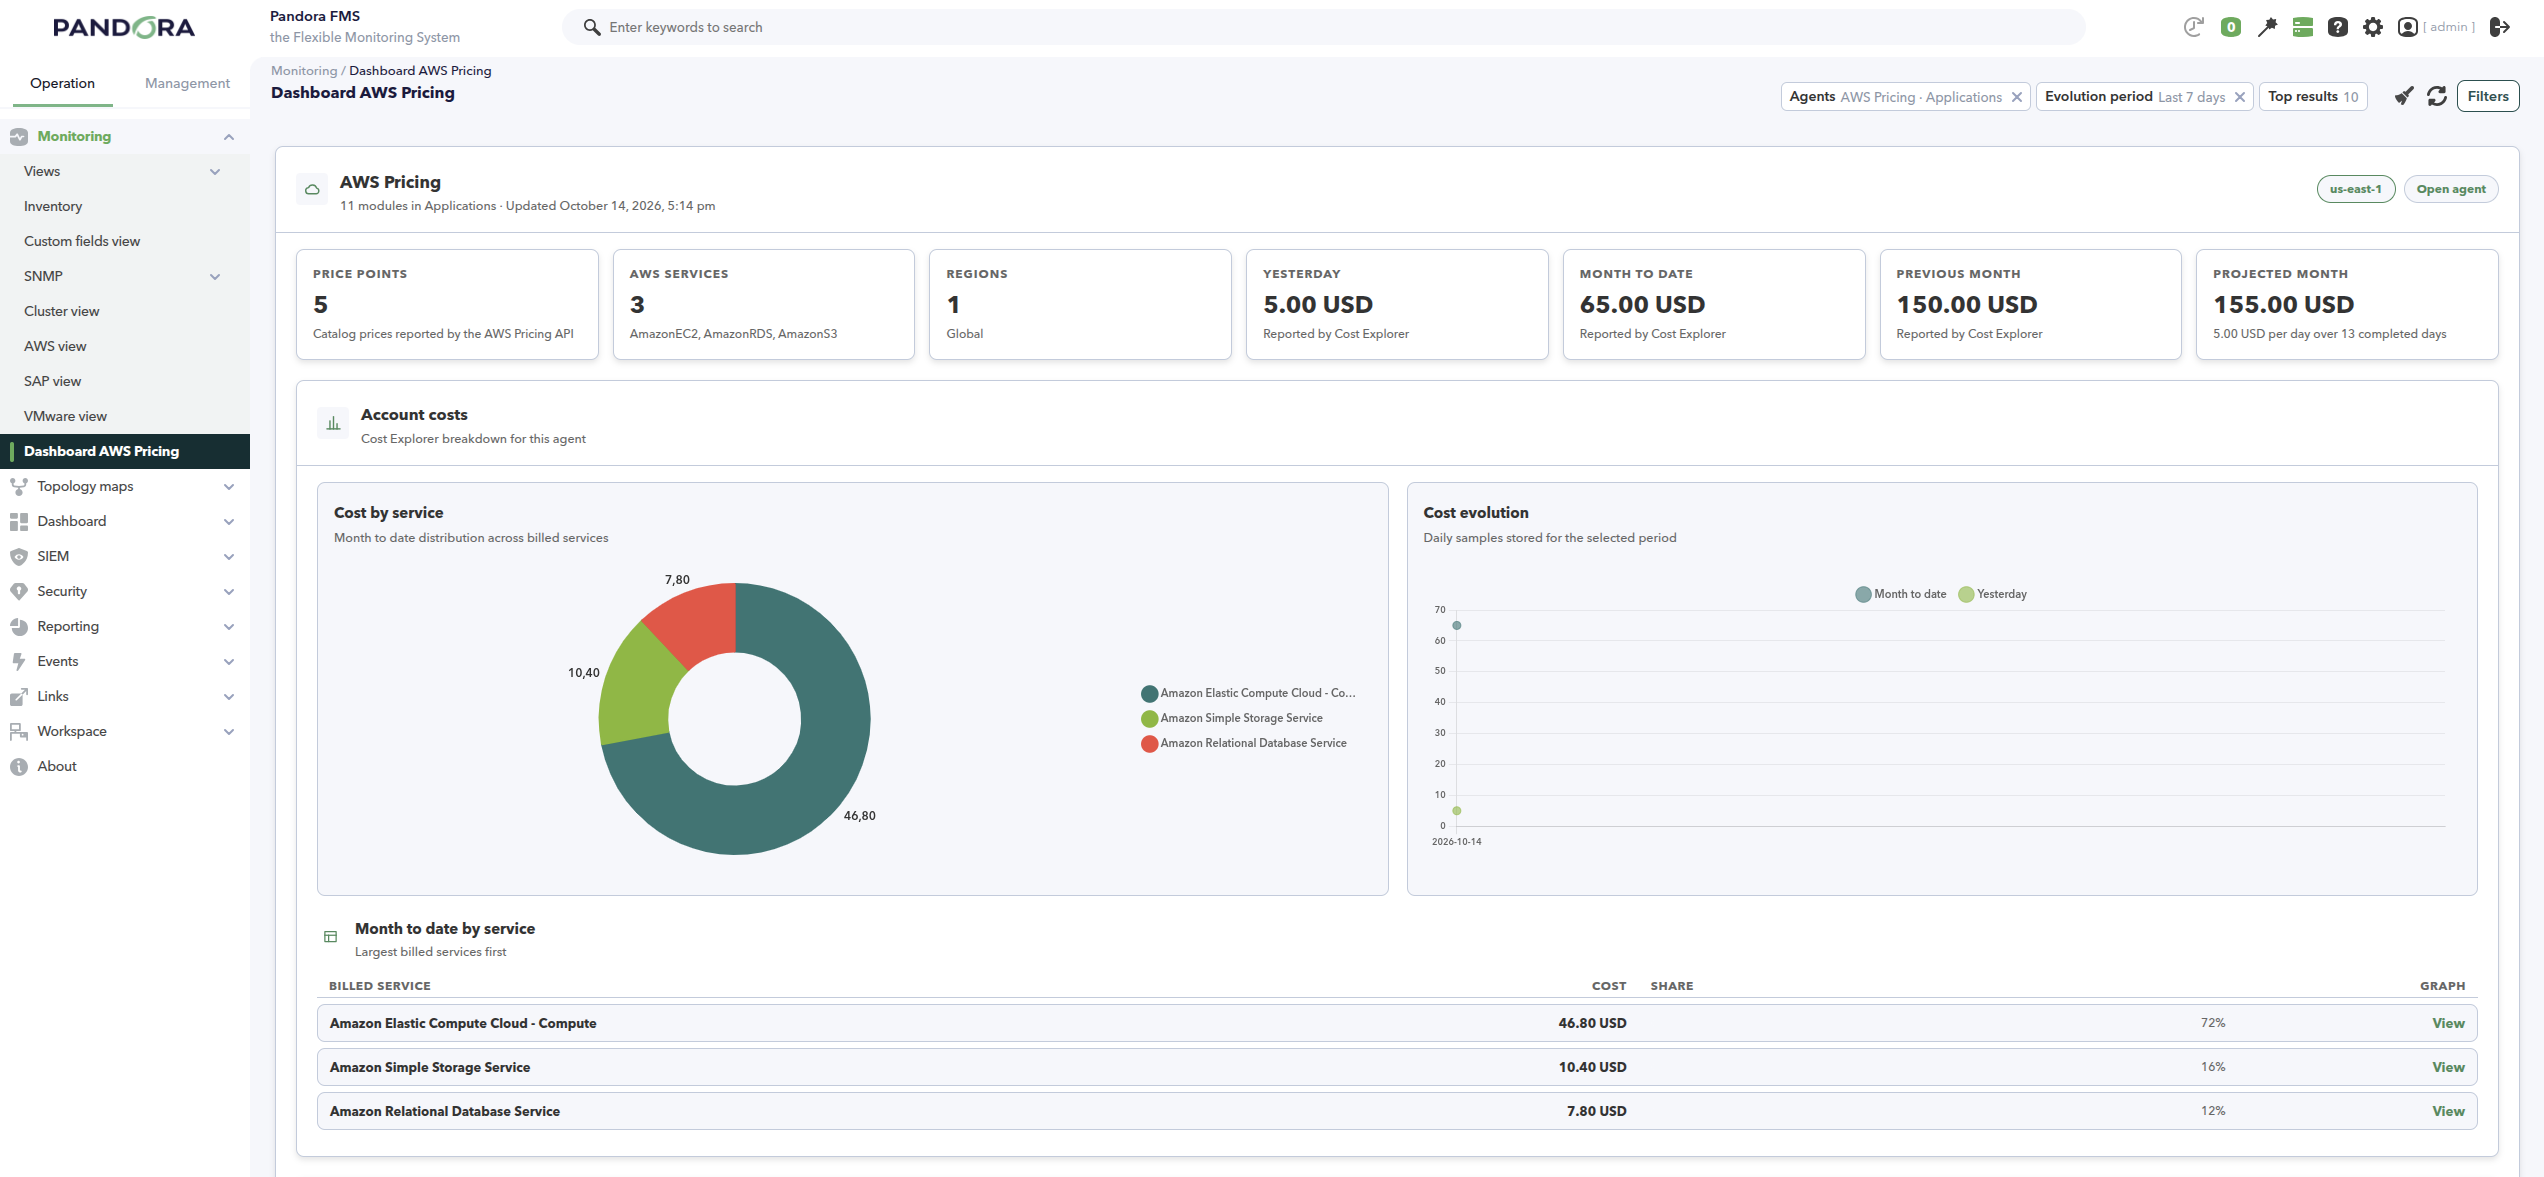
The dashboard is organized into one panel per selected agent. The header shows the agent alias, the AWS pricing region, the cost metric and a link to open the agent. Summary cards show the number of price points, AWS services and regions, the cost for yesterday, month to date and the previous month, and an estimated projection for the current month when month-to-date cost is available. The account costs section adds a cost-by-service chart, cost-by-region and cost-by-account charts when those breakdowns are enabled in the Discovery task, a cost evolution chart and a table of month-to-date cost by service with the share of each service and a link to its module graph. The catalog prices section adds charts for the price points by service and region, a top-prices chart for each unit family and a table with the service, region, module, SKU, price and unit of every monitored price.
A filter narrows the view by agent, AWS service, evolution period and top results. The AWS service filter applies only to catalog prices; account costs remain complete. The dashboard formats cost and price values with the currency reported by AWS, treats unknown values as no data and adapts to the light and dark console themes. It does not create agents or modules, does not query AWS and does not change the monitoring configuration; it only presents data already collected in the console.
What it allows you to do
- See the catalog prices and account costs of every AWS Pricing agent in a single console view.
- Compare the largest billed services, and the regions and linked accounts when those breakdowns are enabled.
- Review the cost for yesterday, month to date and the previous month, and the projected cost for the current month.
- Explore the public unit prices of the selected AWS services by region and unit.
- Filter by agent, service and period, and open the underlying agent or module graph.
What it displays
- Catalog price points per AWS service, region and SKU
- Price points grouped by service, region and unit
- Cost for yesterday, month to date and the previous month
- Month-to-date cost by service, and by region and linked account when those breakdowns are enabled
- Cost evolution for the selected period
- Projected month cost based on completed days
- Agent module count, group and last update time
- Cost metric and AWS pricing region of each agent
How it works
The extension adds an AWS Pricing entry to the console status menu. When it is opened, it finds the agents created by the AWS Pricing Discovery plugin through the marker stored in their extra data and reads the latest values of their modules from the console database. It also reads the module history stored in the console to draw the cost evolution chart. The values are grouped into one panel per agent, and the summary cards, charts and tables are built from the catalog and cost modules present. The filter narrows the panels to the selected agents and services, and the evolution period and top results control the history window and the number of rows and chart slices. Agents with no modules show a message to run the Discovery task again, and an agent without cost modules shows a message to enable a cost token in the task.
Filters
- Agents: select one or more AWS Pricing agents. Leaving the selection empty shows every agent the user can see.
- AWS services: narrows the catalog price section to the selected service codes. Account costs are not filtered.
- Evolution period: 7, 15, 30 or 90 days for the cost evolution chart and the module graph links. The default is 30 days.
- Top results: limits the number of rows and chart slices in the cost and catalog sections. The default is 10 and the maximum is 100.
Benefits
- Catalog prices and account spend become visible in one console view instead of across individual agents and modules.
- Operators can identify the largest billed services, regions and accounts without building a report.
- The cost evolution and the projected month help follow spend during the billing period.
- The dashboard reuses the data and permissions already stored in the console, so it needs no separate data collection or access control.
Use cases
- Cloud operations and finance teams that review AWS spend by service, region and linked account.
- Teams that compare the public catalog price of a service with the cost reported by AWS Cost Explorer.
- Environments that need to follow month-to-date spend and estimate the end-of-month cost.
- Operators who need to move from a cost figure to the underlying module graph during an investigation.
Requirements
- A Pandora FMS console where the extension is installed.
- The AWS Pricing Discovery plugin installed and a Discovery task that has created the AWS Pricing agent and its modules.
- The AWS Cost Explorer API enabled in the account and at least one cost token enabled in the Discovery task for cost figures.
- Catalog price tokens enabled in the Discovery task for catalog prices.
- Agent read or reporting read permission on the console, or administrator access, for the user who opens the dashboard.
- No additional runtime; the extension runs inside the console.
Tags
Categories
×
![]()
From this entry
Newest from same author
Newest in same categories
Newest with same tags
