




VMware Horizon Dashboard
1.0
 Extension » pandorafms.horizon.dashboard
Last update: 2026-11-03 11:27:15

Description
VMware Horizon Dashboard is a Pandora FMS console extension that presents the agents and modules created by the VMware Horizon plugin. It combines session and user counters, distribution charts, historical trends, health and usage metrics, and tables for desktop pools, servers, gateways, machines, disks, App Volumes and virtual datacenters. You can filter by agent and resource type, and drill into any resource to review its modules and history. The extension visualizes stored monitoring data; it does not collect VMware Horizon data itself.
Images
Additional information
VMware Horizon Dashboard is a Pandora FMS console extension that turns the agents and modules created by the VMware Horizon plugin into an operational dashboard. It does not collect data from VMware Horizon itself: it reads the monitoring data already stored in Pandora FMS and presents it in one view.
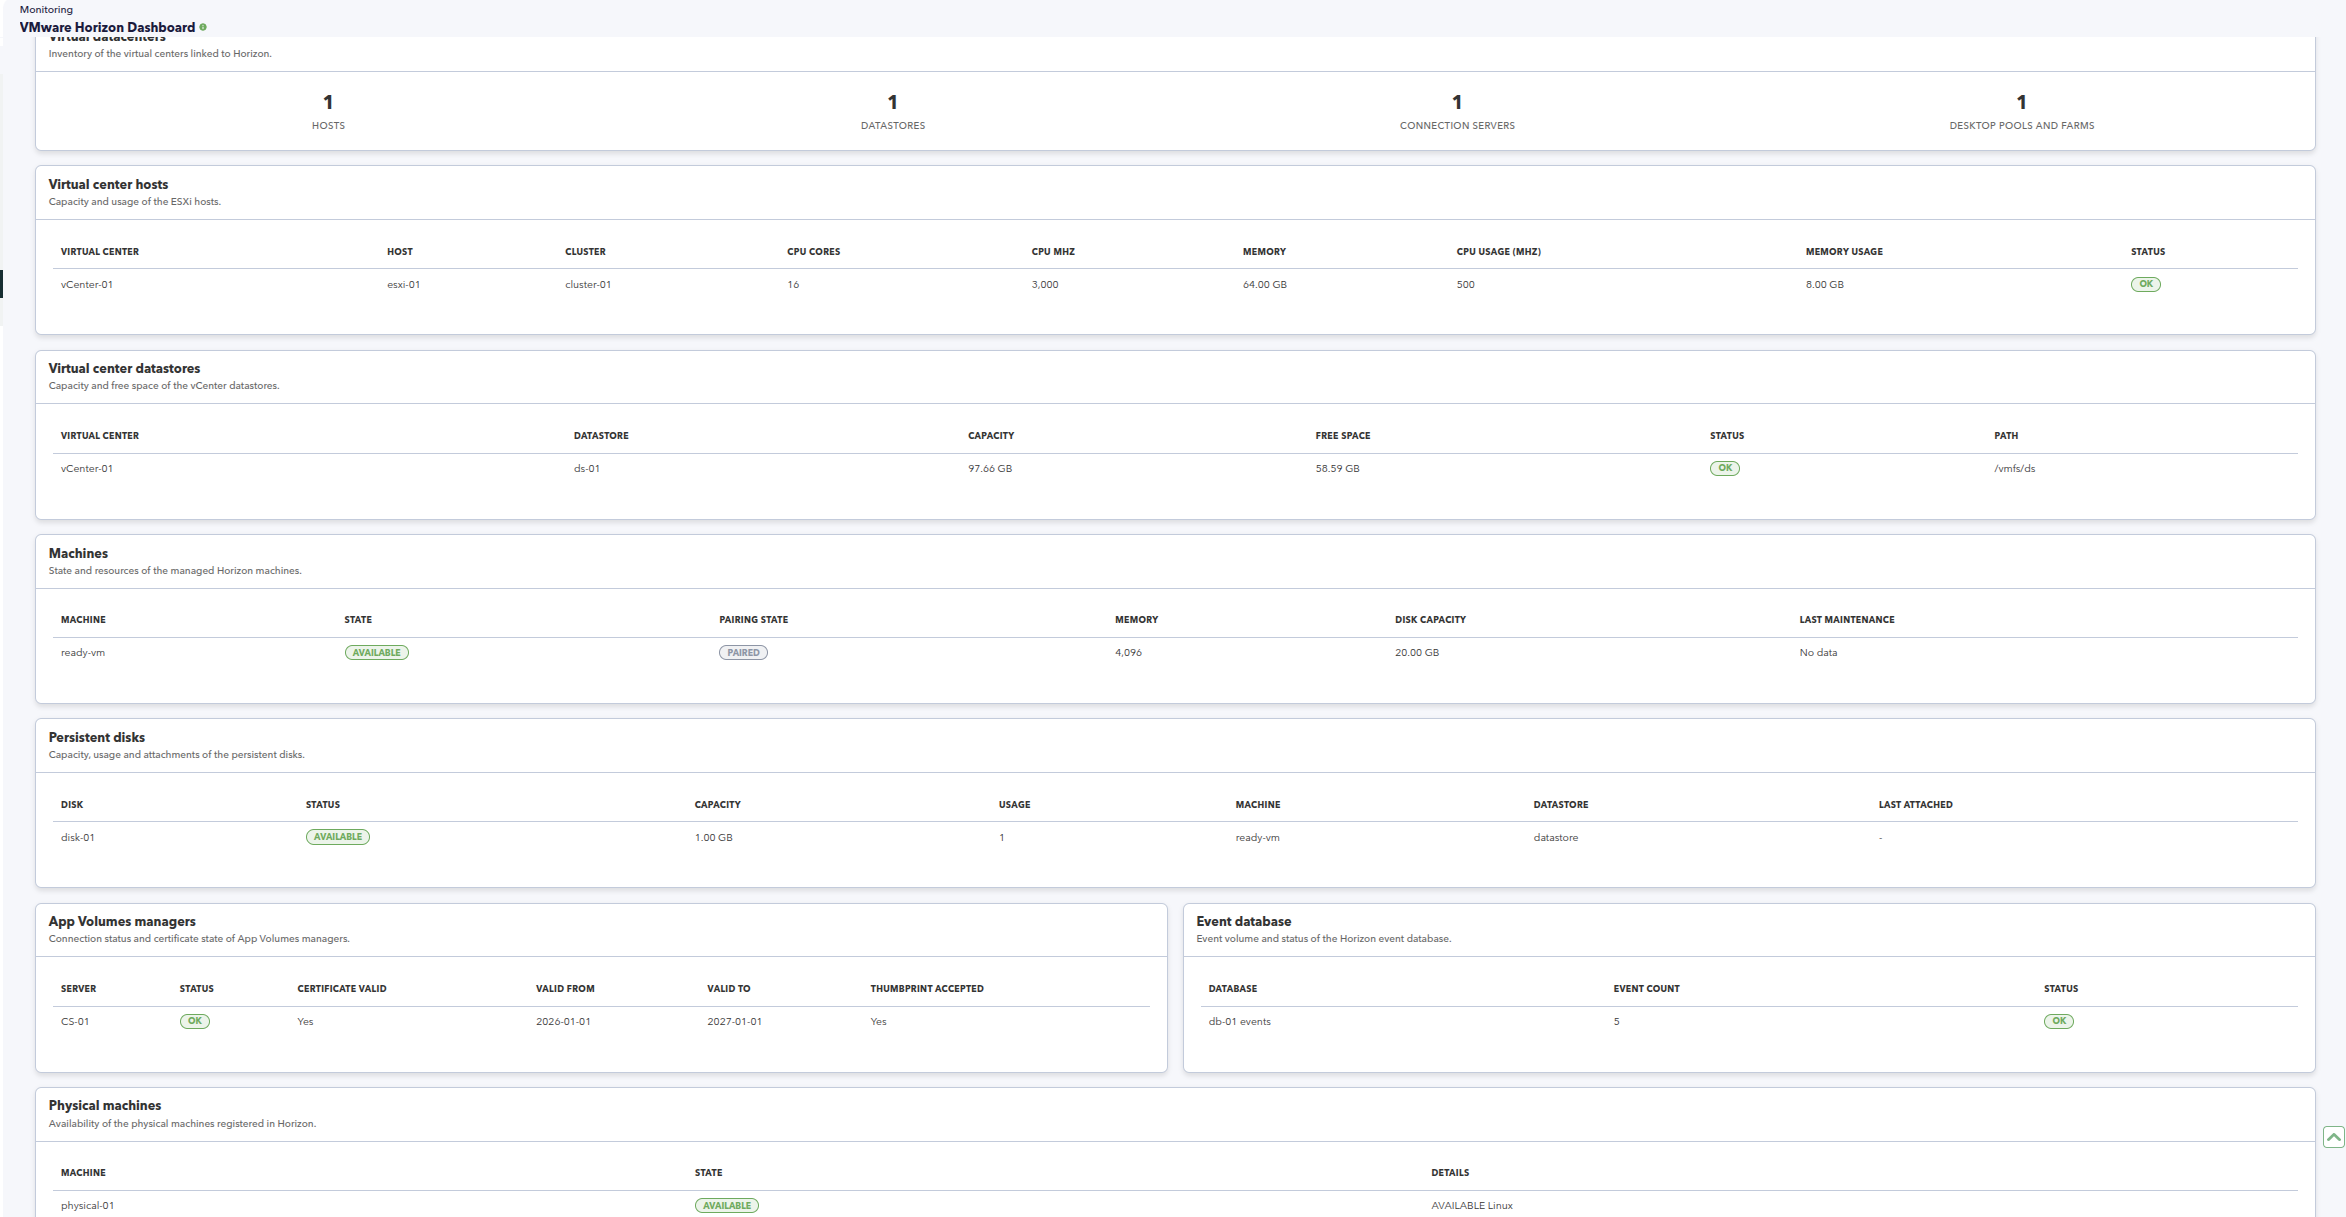
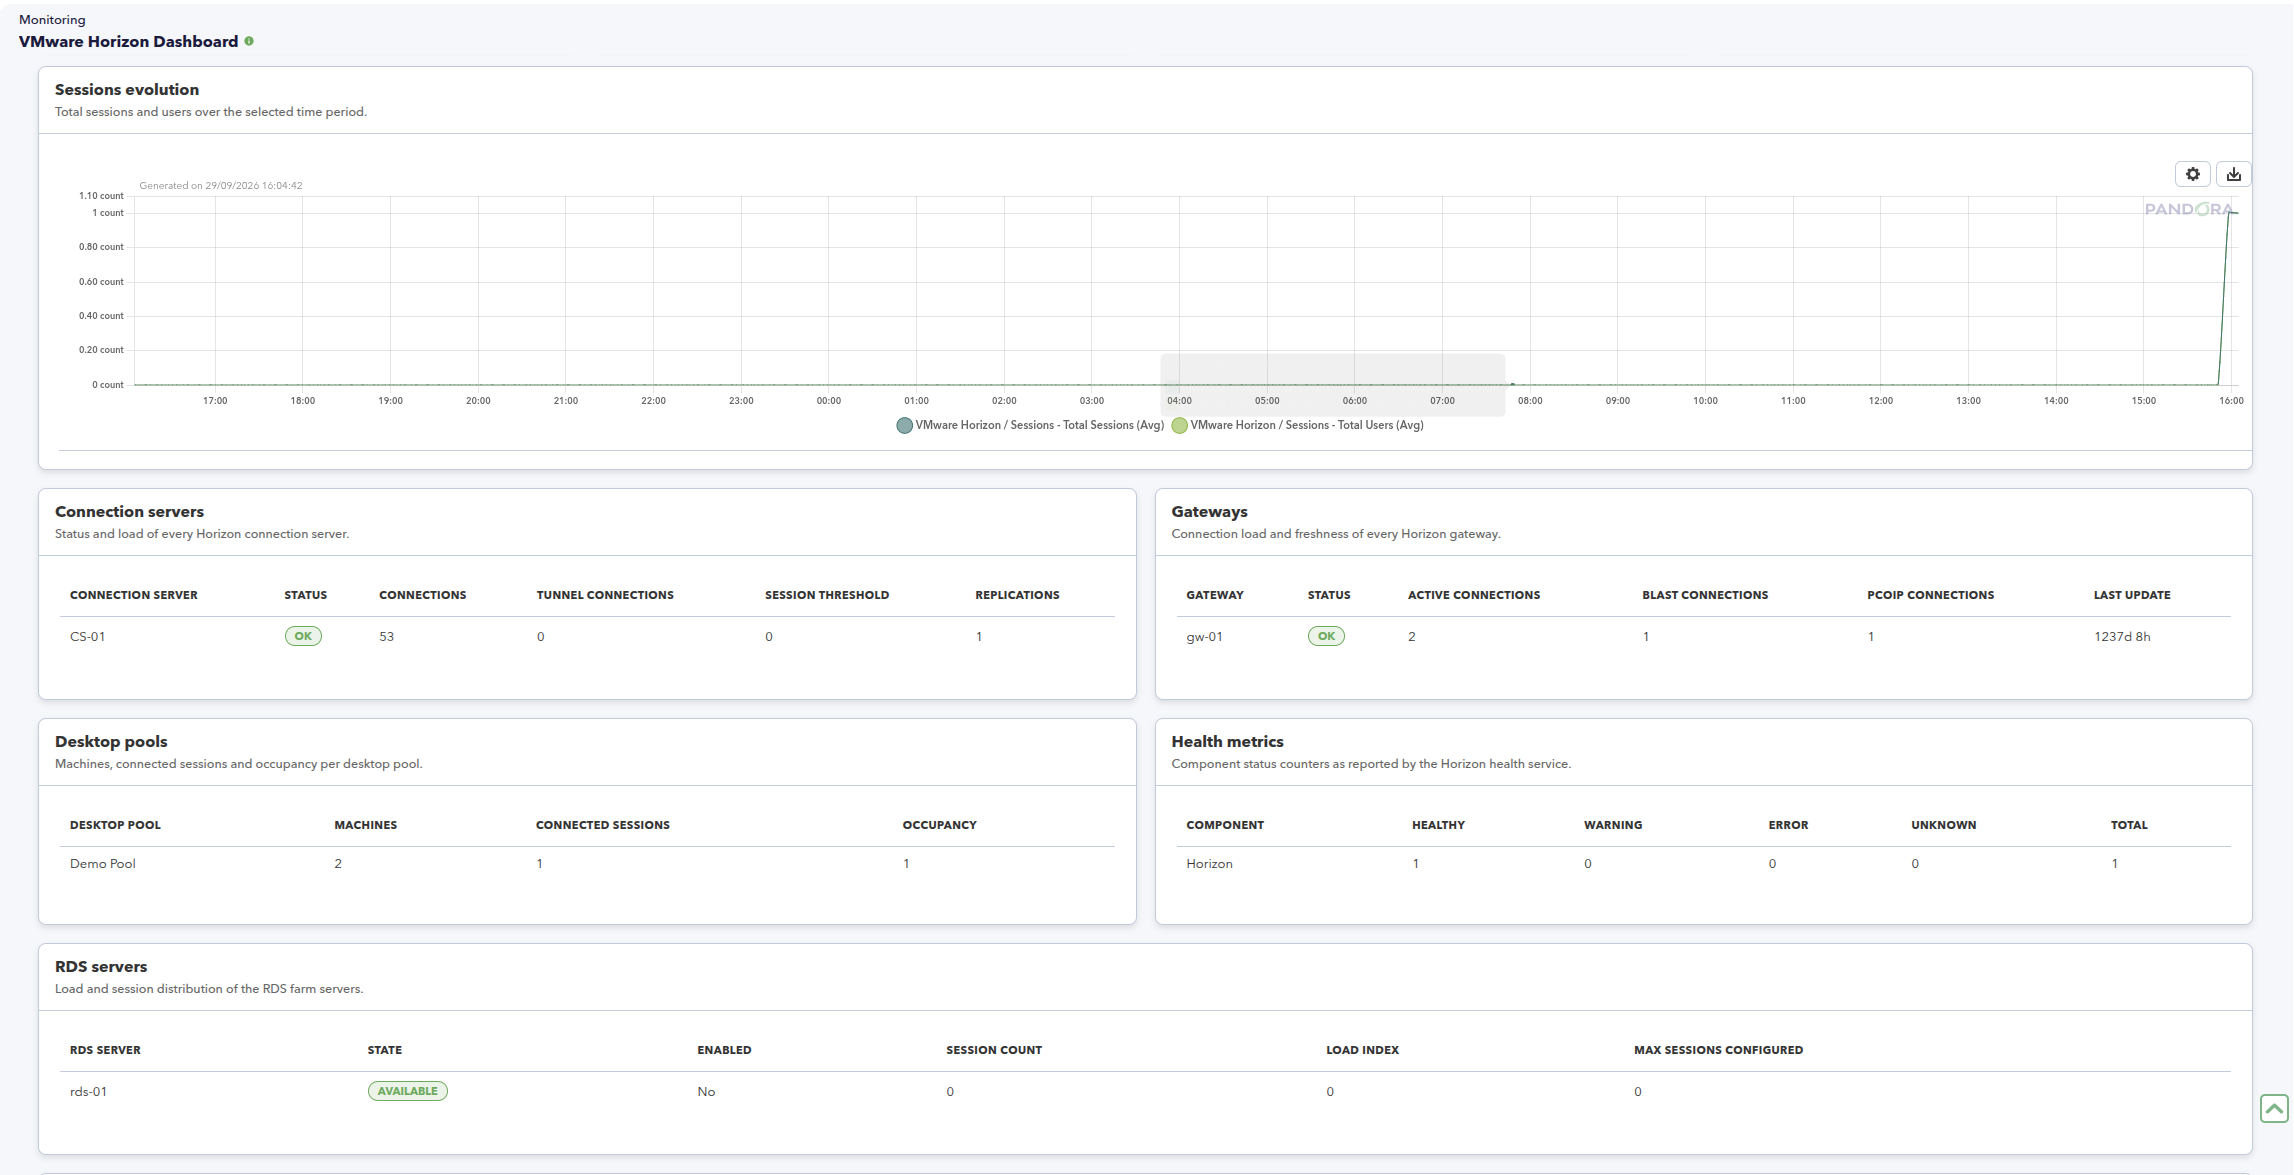
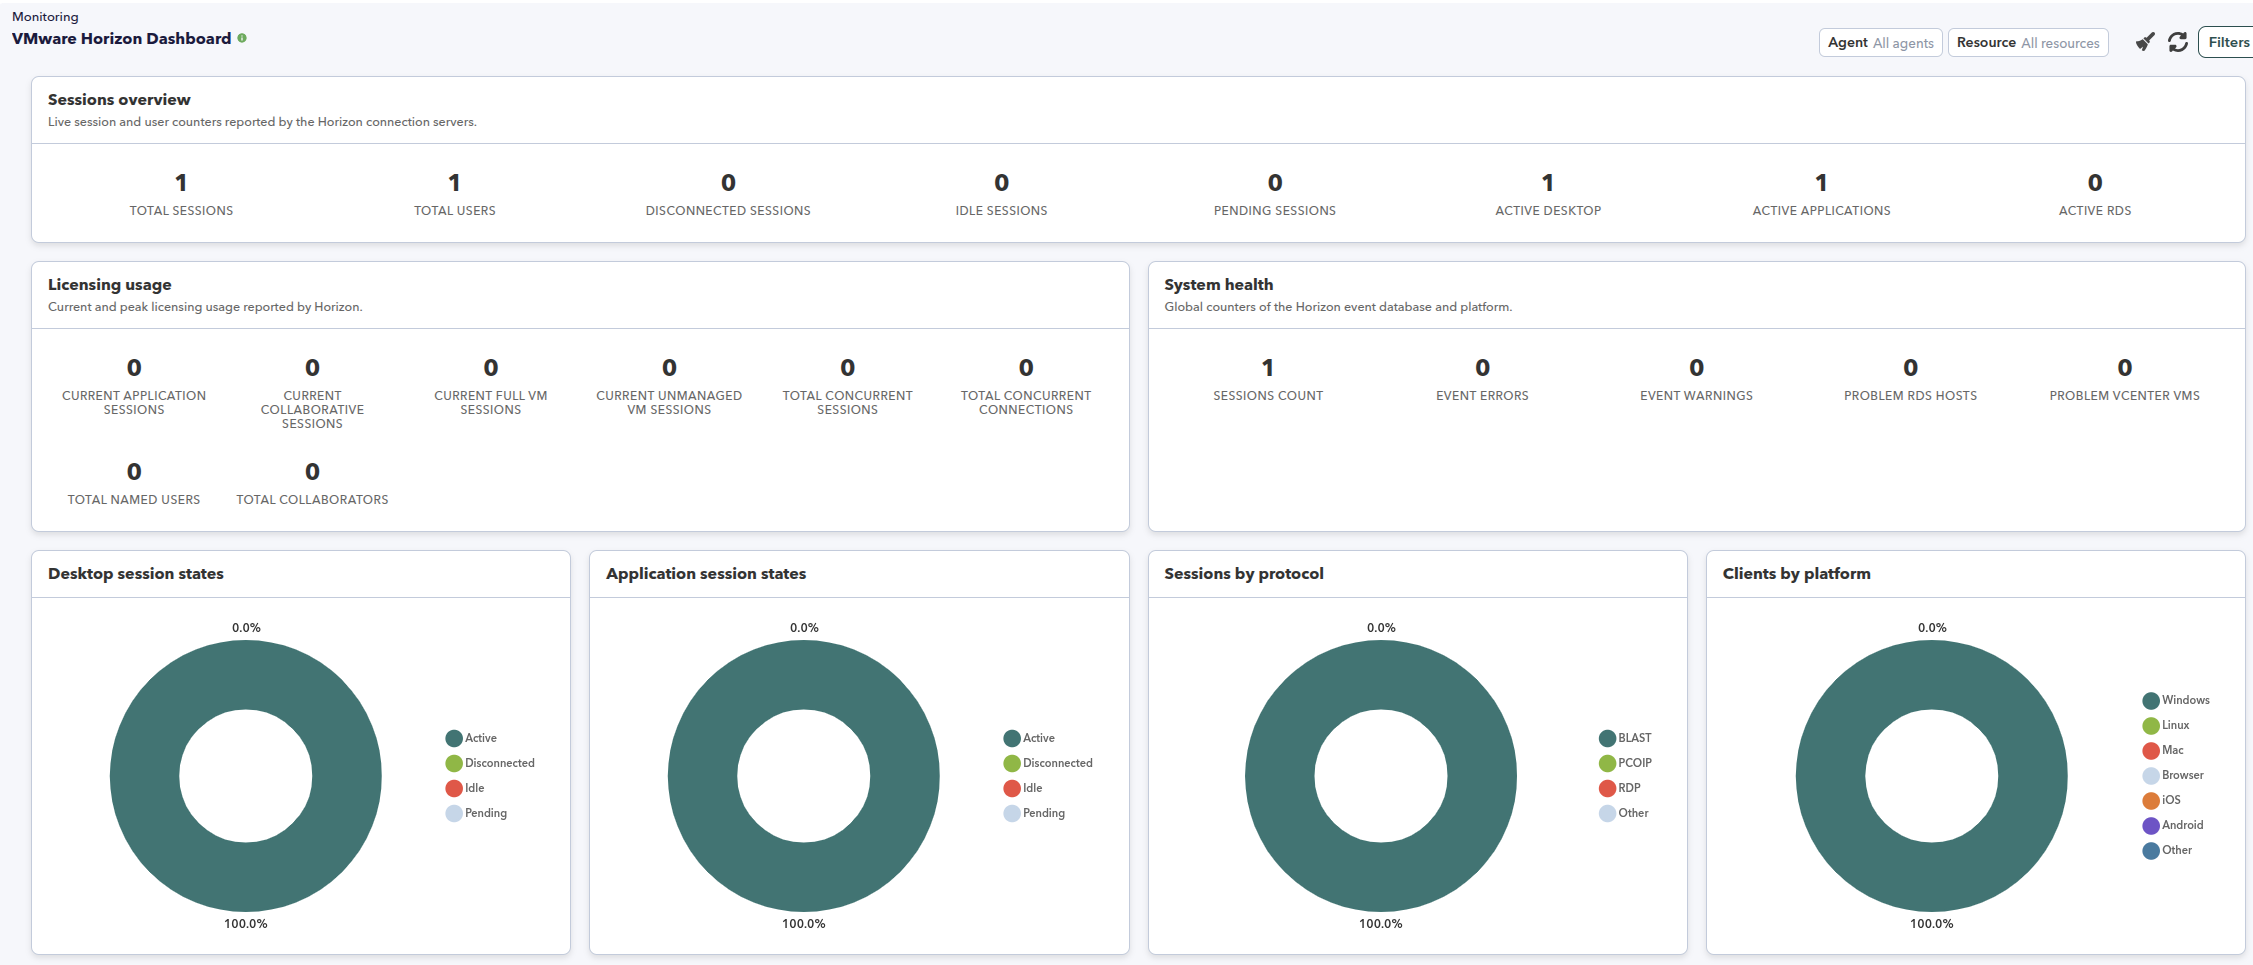
The dashboard opens with a filter for the agent, the resource type and the chart period. The default view combines session and user counters, session distribution charts, usage and system health counters, and a historical graph of total sessions and users. It then adds tables for desktop pools, RDS servers, connection servers, gateways, machines, physical machines, persistent disks, App Volumes managers, the event database and virtual datacenter hosts and datastores.
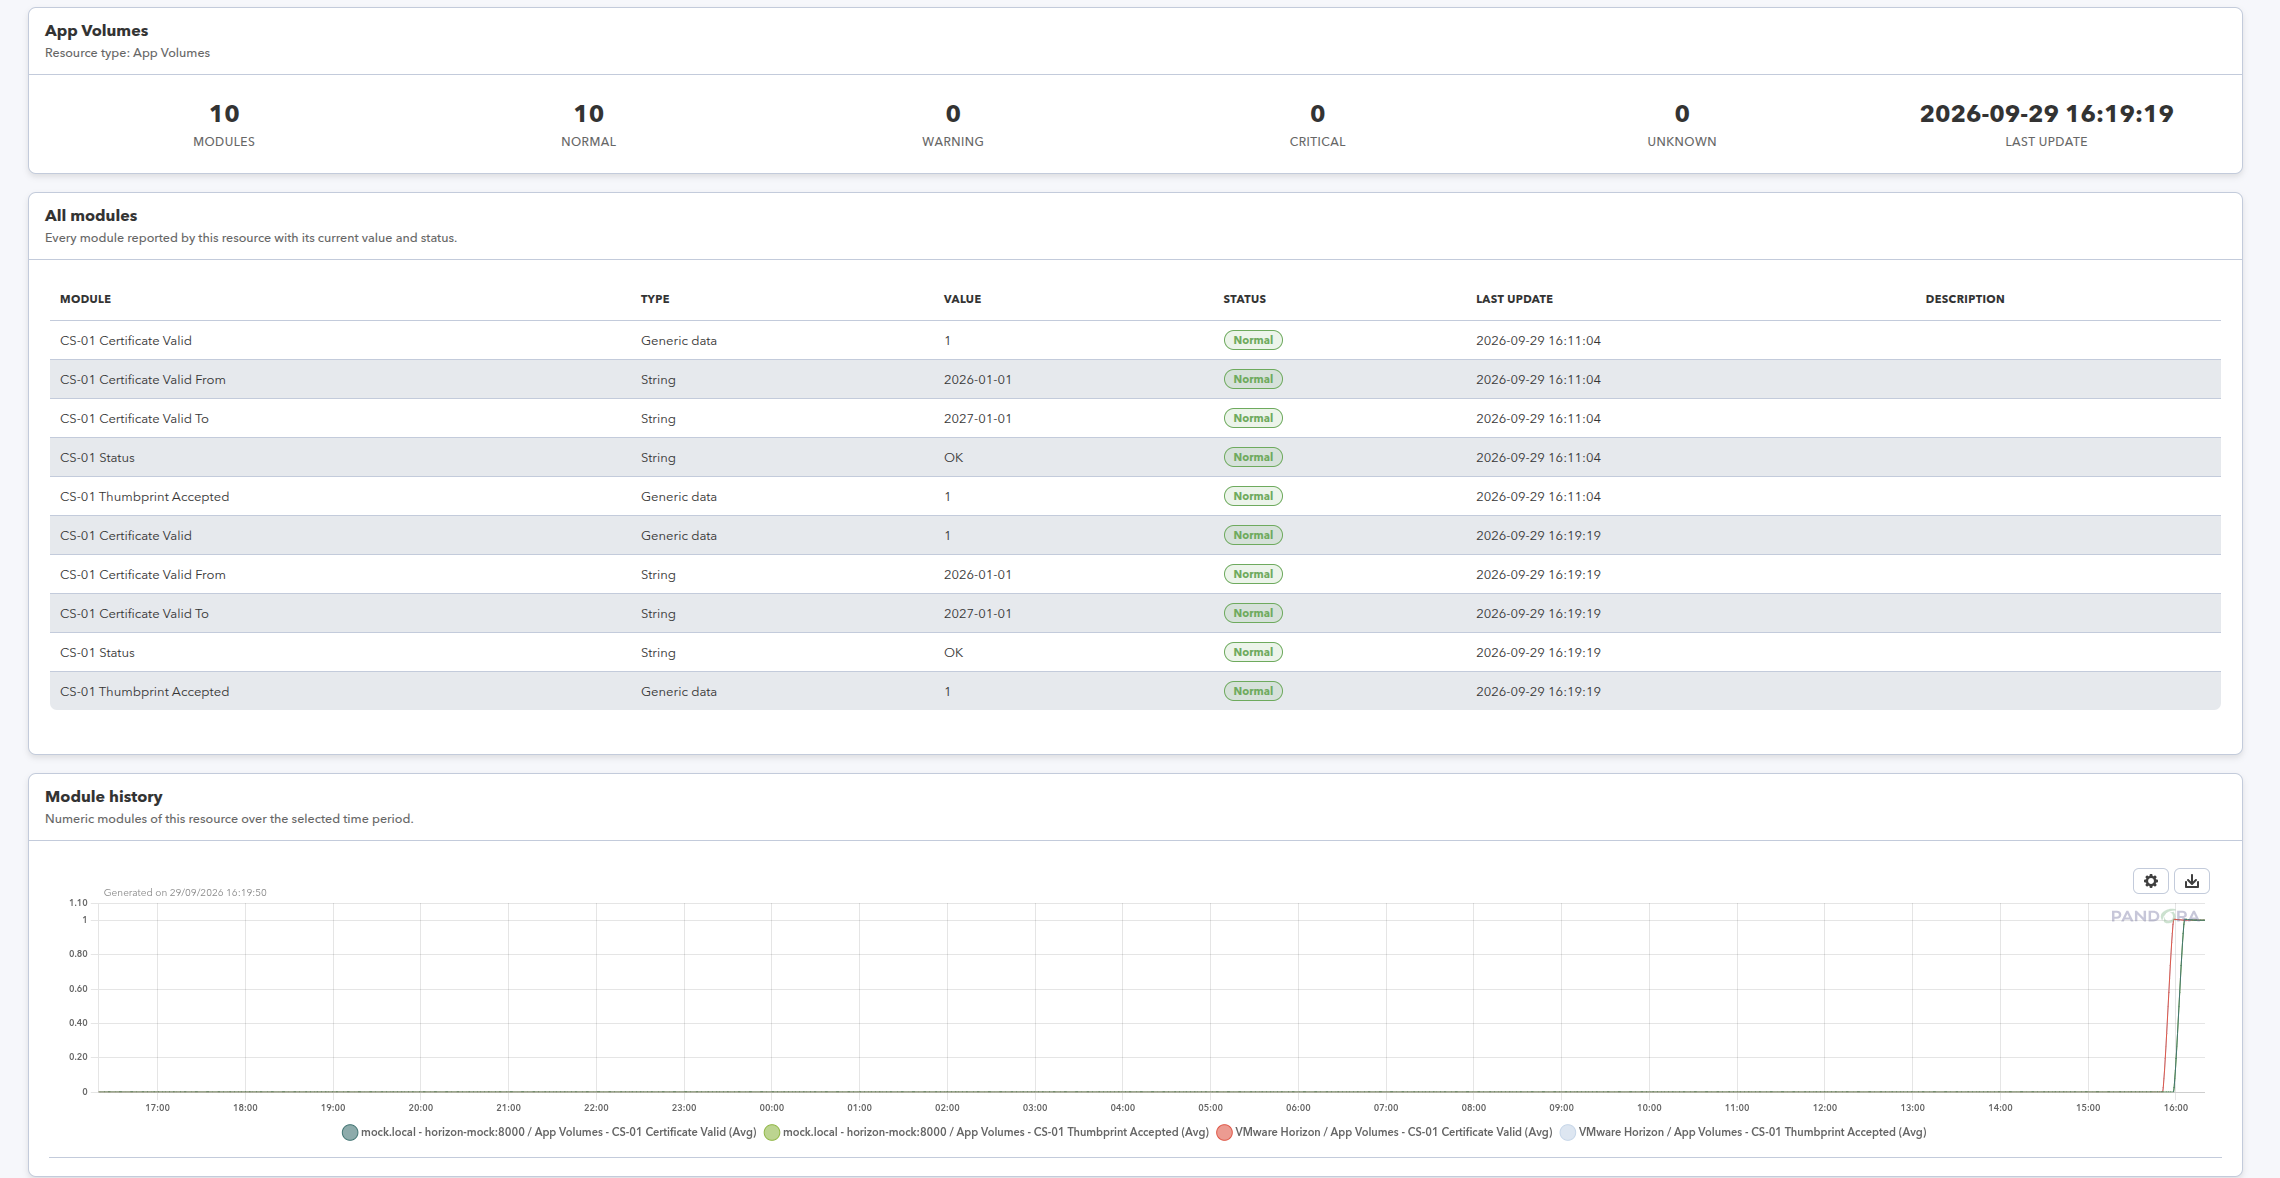
Selecting a specific resource opens a detail view with the number of modules, their states, the last update time, a table of every module and the available history graphs. This makes it possible to move from a consolidated view to the individual metrics behind a pool, server, machine or disk without leaving the console.
The extension shows the latest values stored by the plugin, so its freshness follows the Discovery task interval. It is read-only and does not change VMware Horizon or the monitoring configuration.
What it allows you to do
- Open a single dashboard for the VMware Horizon agents created by the companion plugin.
- Filter by agent and resource type, and choose the chart period.
- Review session and user activity with KPIs and distribution charts.
- Inspect desktop pool, server, gateway, machine, disk, App Volumes and datastore state.
- Drill into a resource to see all its modules, current values, states and history.
What it displays
- Session and user counters: total sessions, total users, active desktop, application and RDS sessions, plus disconnected, idle and pending sessions.
- Session distributions by desktop and application state, protocol and client platform.
- Historical evolution of total sessions and users for the selected period.
- Desktop pools, RDS servers, machines, physical machines and persistent disks.
- Connection servers, gateways, App Volumes managers and event database status.
- Health metrics by component.
- Usage metrics and system health counters.
- Virtual datacenter hosts and datastores, plus a per-resource module detail with history.
How it works
- Install the console extension and open VMware Horizon Dashboard from the Status menu.
- The extension finds the agents created by the VMware Horizon plugin and loads their modules and latest values.
- Select an agent, a resource type and a chart period to scope the dashboard.
- The dashboard renders session KPIs and charts, usage and system counters, and infrastructure tables; selecting a resource opens its module detail and history.
- If no matching data is found, the dashboard shows an empty state that asks you to run the Discovery task and verify the agents and modules.
Benefits
- Consolidates VMware Horizon session, infrastructure and capacity data in one console view.
- Reduces the need to inspect agents and modules one by one.
- Makes session states, unhealthy components and certificate issues visible at a glance.
- Supports historical review over selectable periods for capacity and trend analysis.
Use cases
- Virtual desktop teams reviewing session load and user activity.
- Operations checking desktop pool, RDS server and gateway health.
- Troubleshooting App Volumes certificate state and unhealthy components.
- Capacity planning for persistent disks and virtual datacenter datastores.
Requirements
- A Pandora FMS console with the VMware Horizon plugin installed and at least one Discovery task that has generated agents and modules.
- VMware Horizon agents and modules generated by a compatible version of the plugin.
- A user account with permission to view those agents and open the extension.
Tags
Categories
×
![]()
From this entry
Newest from same author
Newest in same categories
Newest with same tags
