




RabbitMQ Dashboard
1.0
 Extension » pandorafms.rabbitmq.dashboard
Last update: 2026-11-03 16:54:37

Description
The RabbitMQ Dashboard is a Pandora FMS console extension that presents the state of the RabbitMQ resources monitored by the RabbitMQ Discovery plugin in a single view. It gathers the cluster overview, the global message rates, the nodes, the queues, the exchanges, the connections, the channels and the virtual hosts into key numbers, tables and charts. It reads the agents and modules already created in the console and does not collect data on its own.
Images
Additional information
The extension adds a dashboard to the Pandora FMS console status menu, available to users with agent read permission. It identifies every RabbitMQ agent created by the RabbitMQ Discovery plugin and reads the latest values and states of its modules, so the information matches the data collected by the Discovery task.
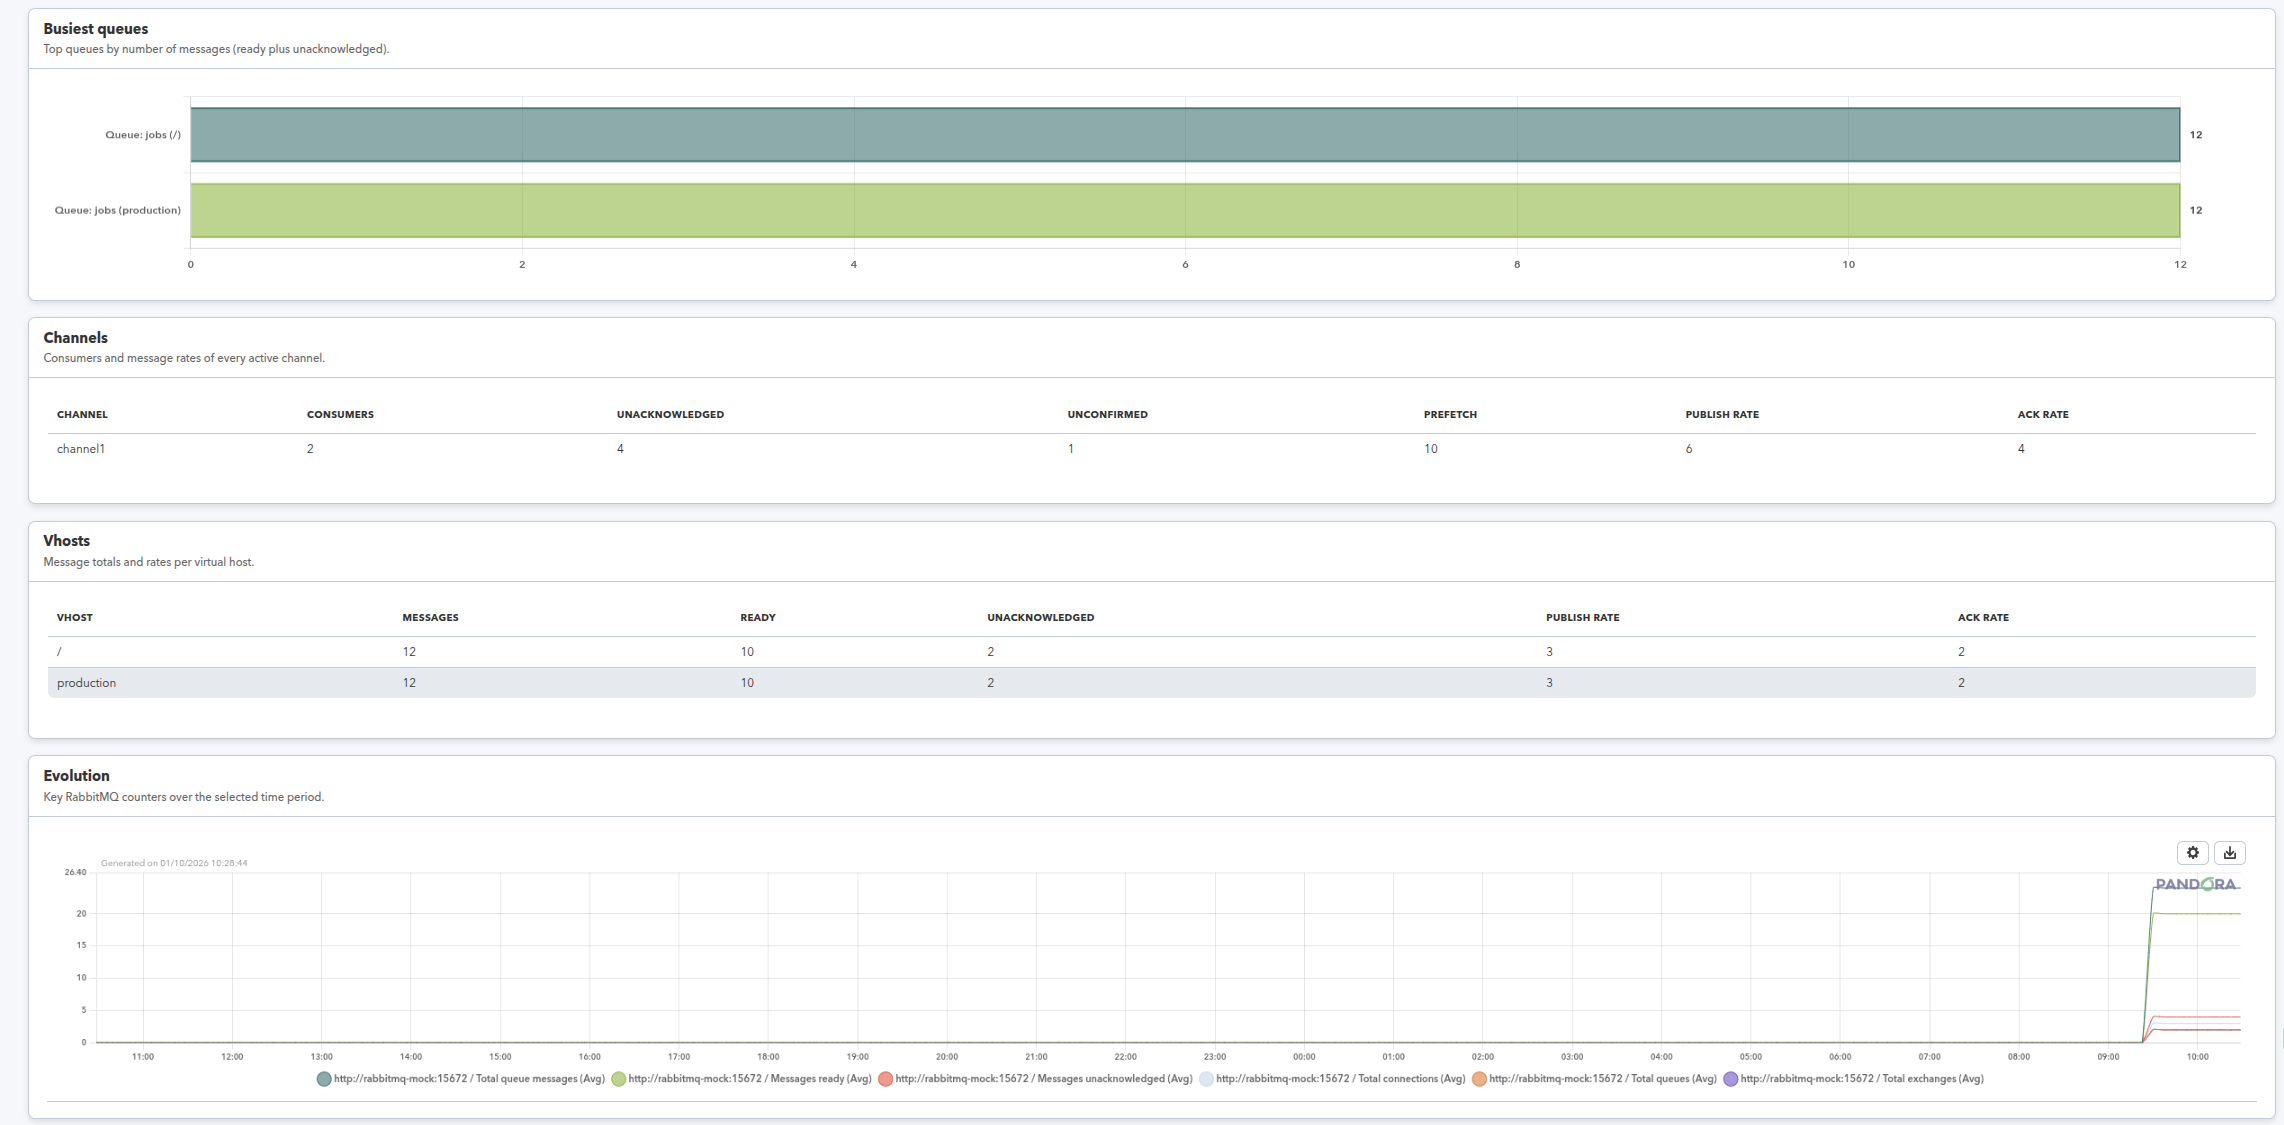
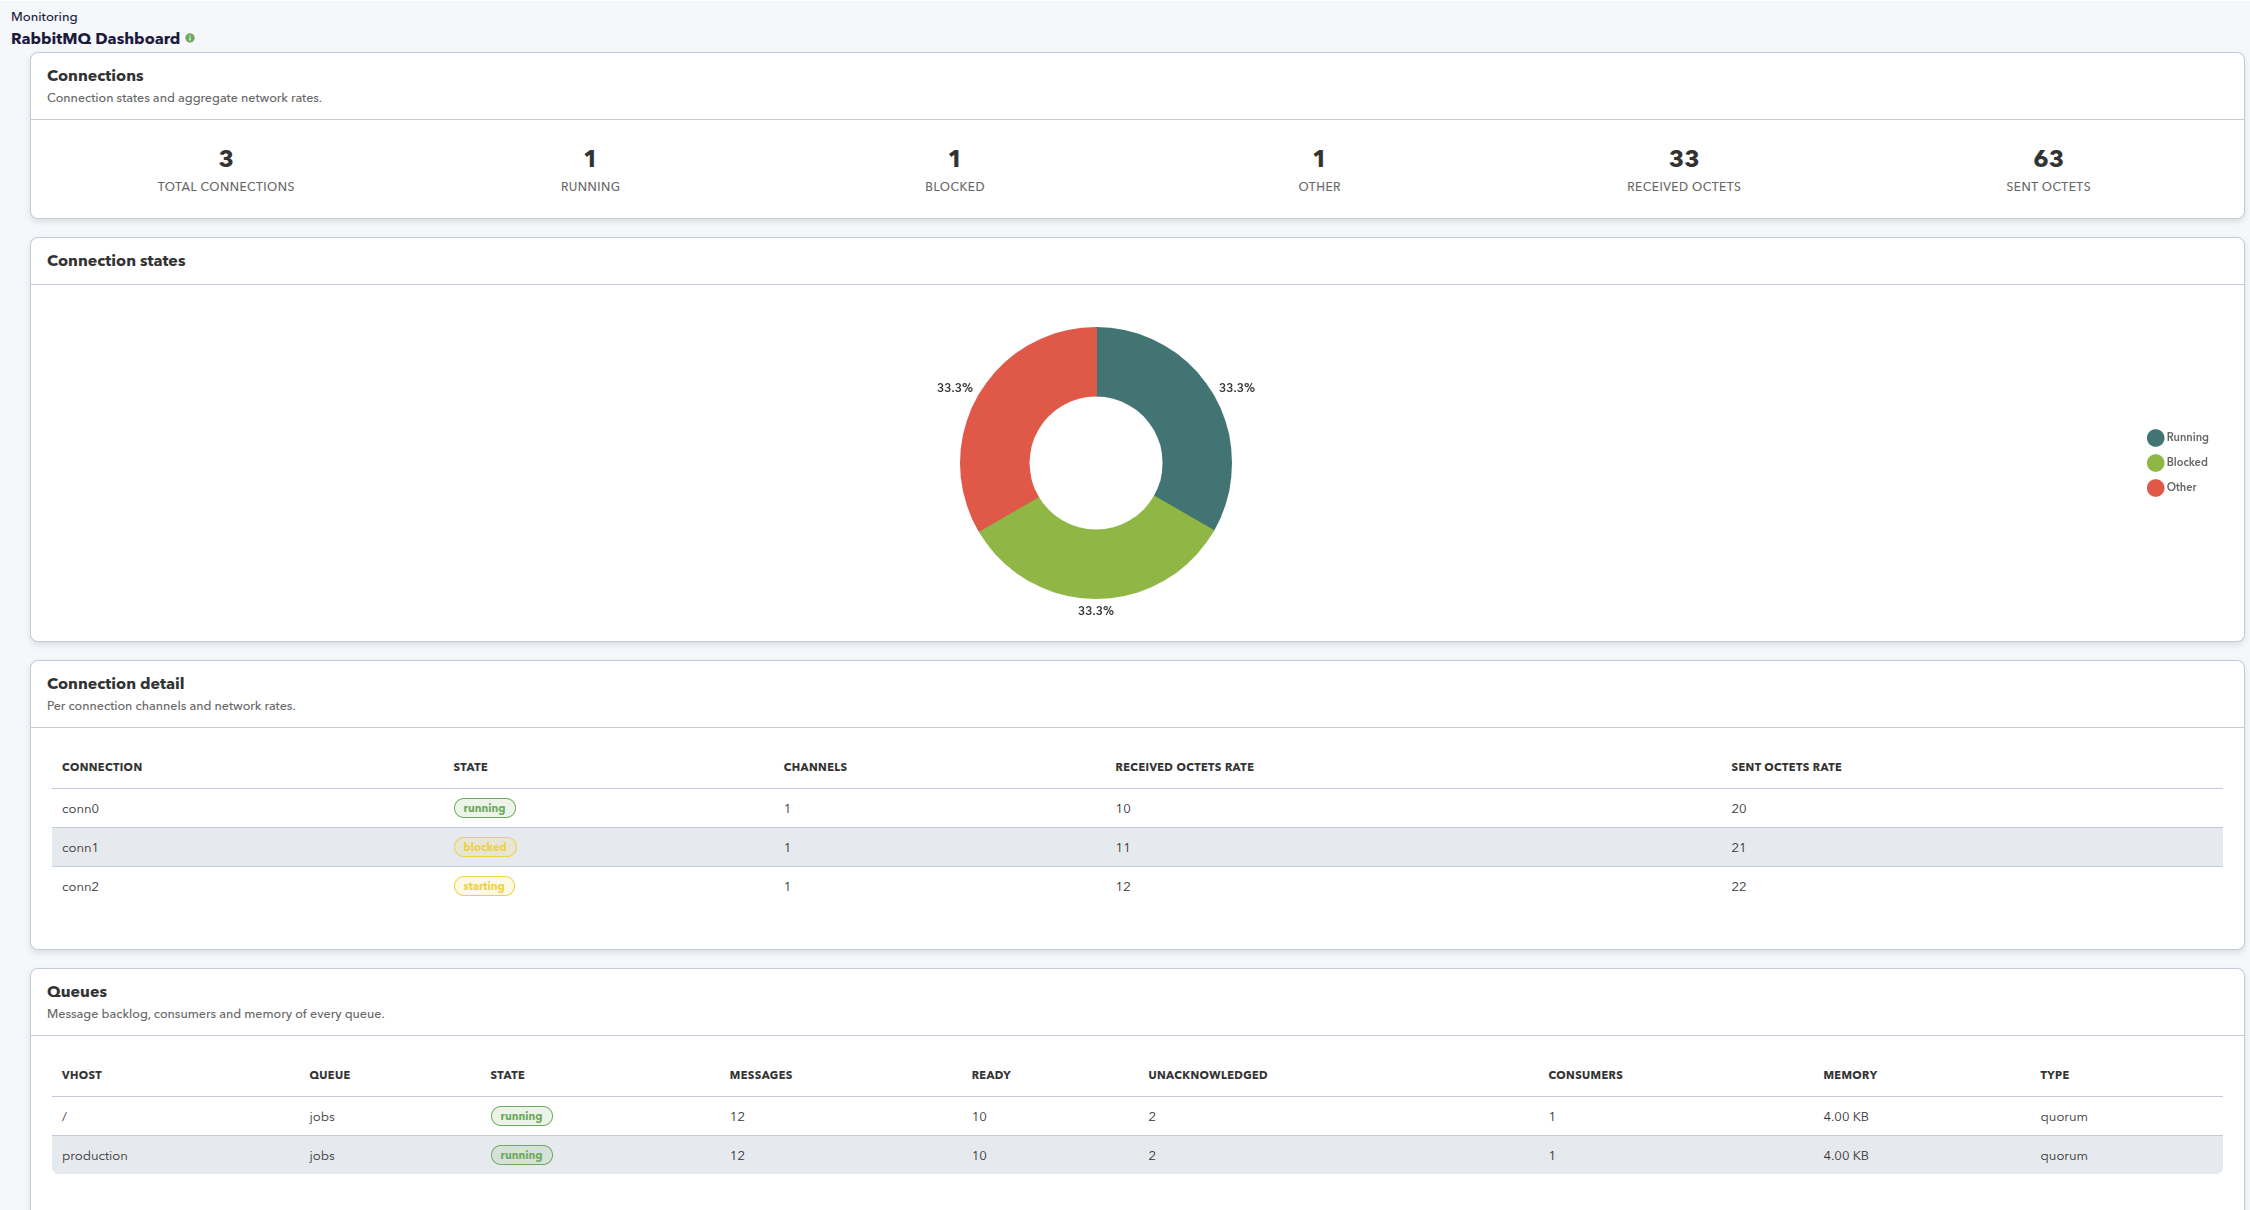
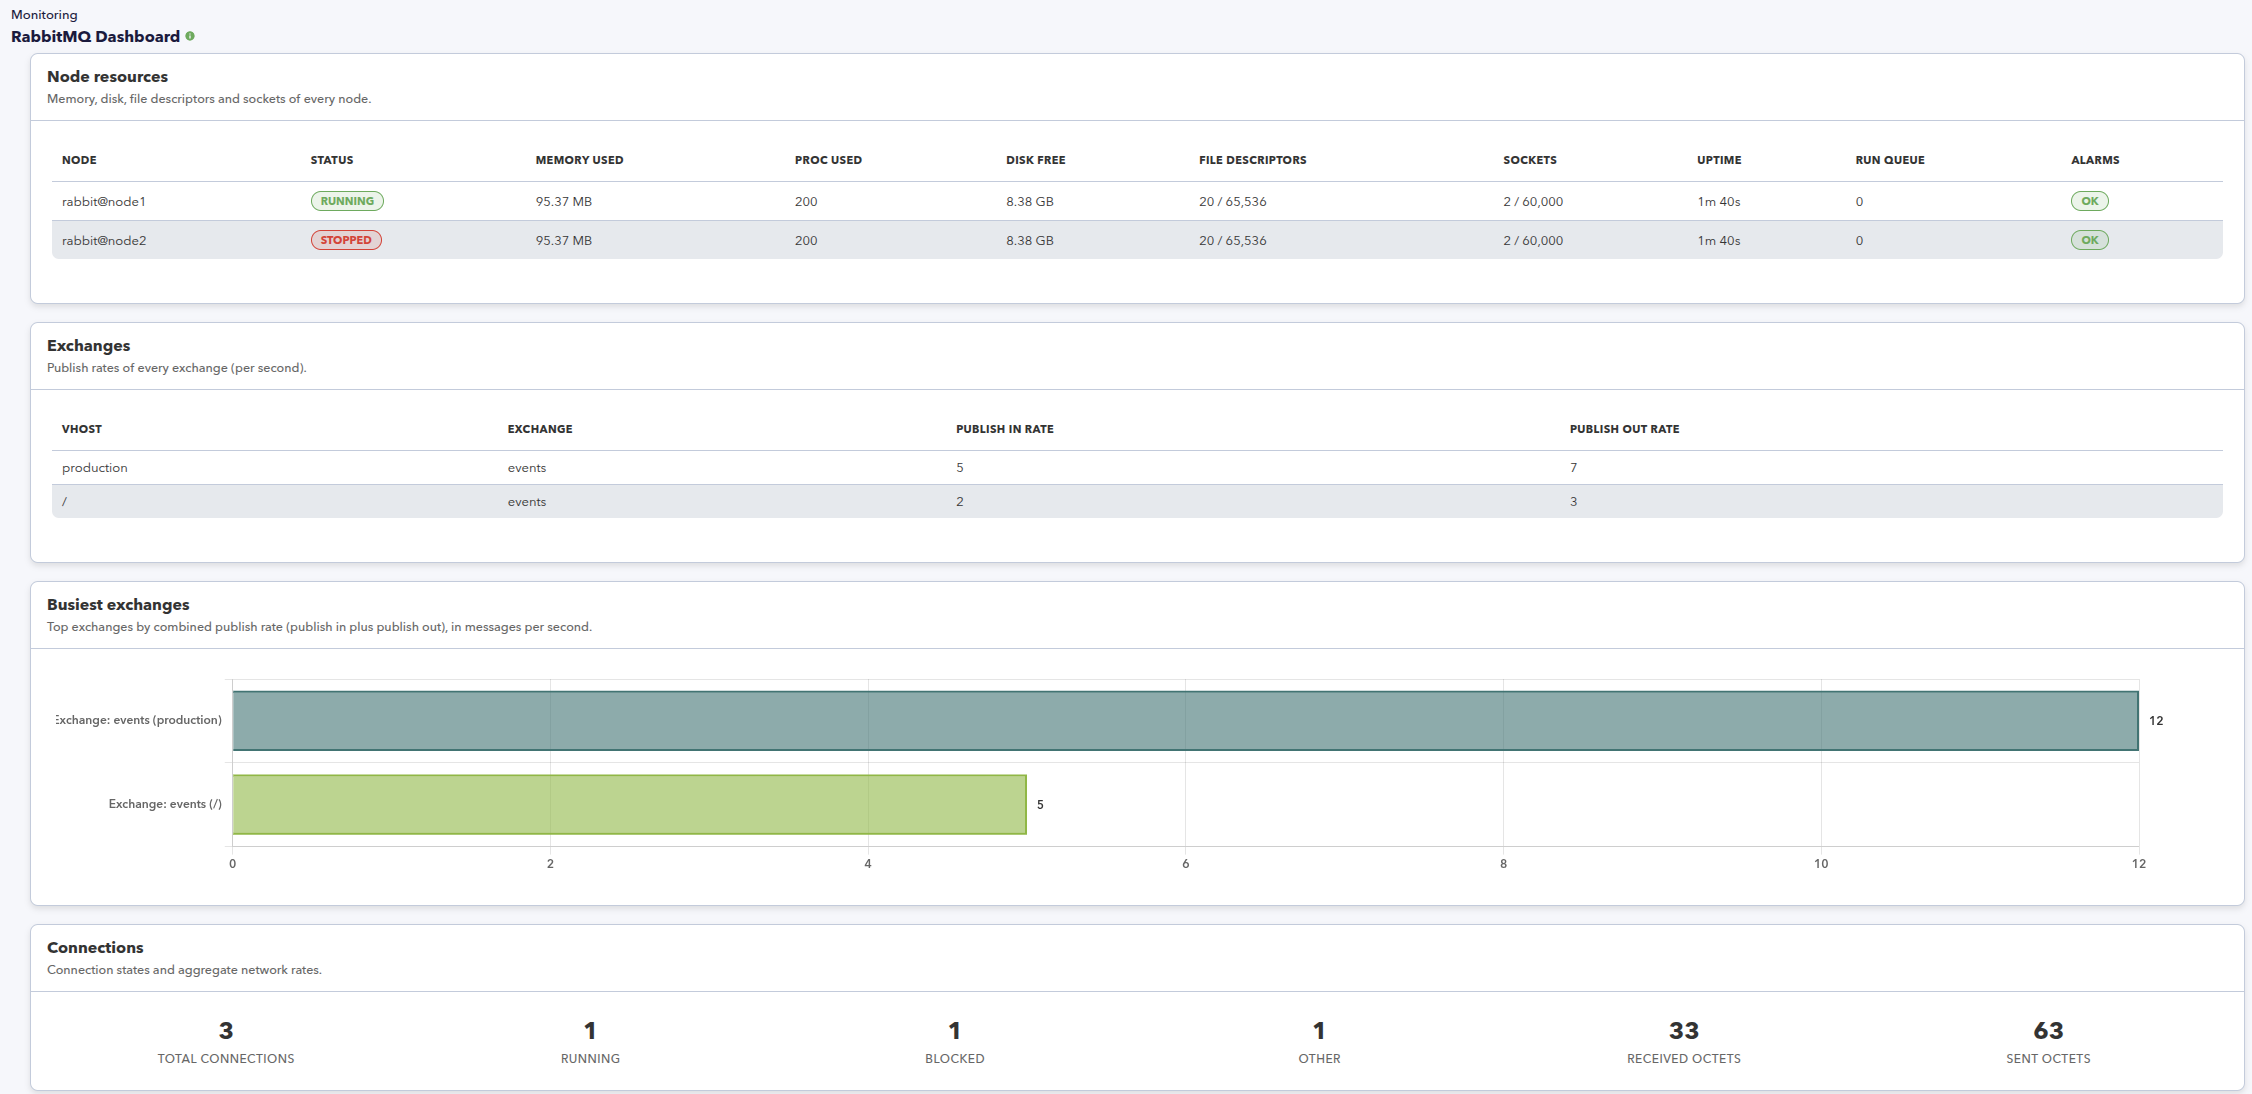
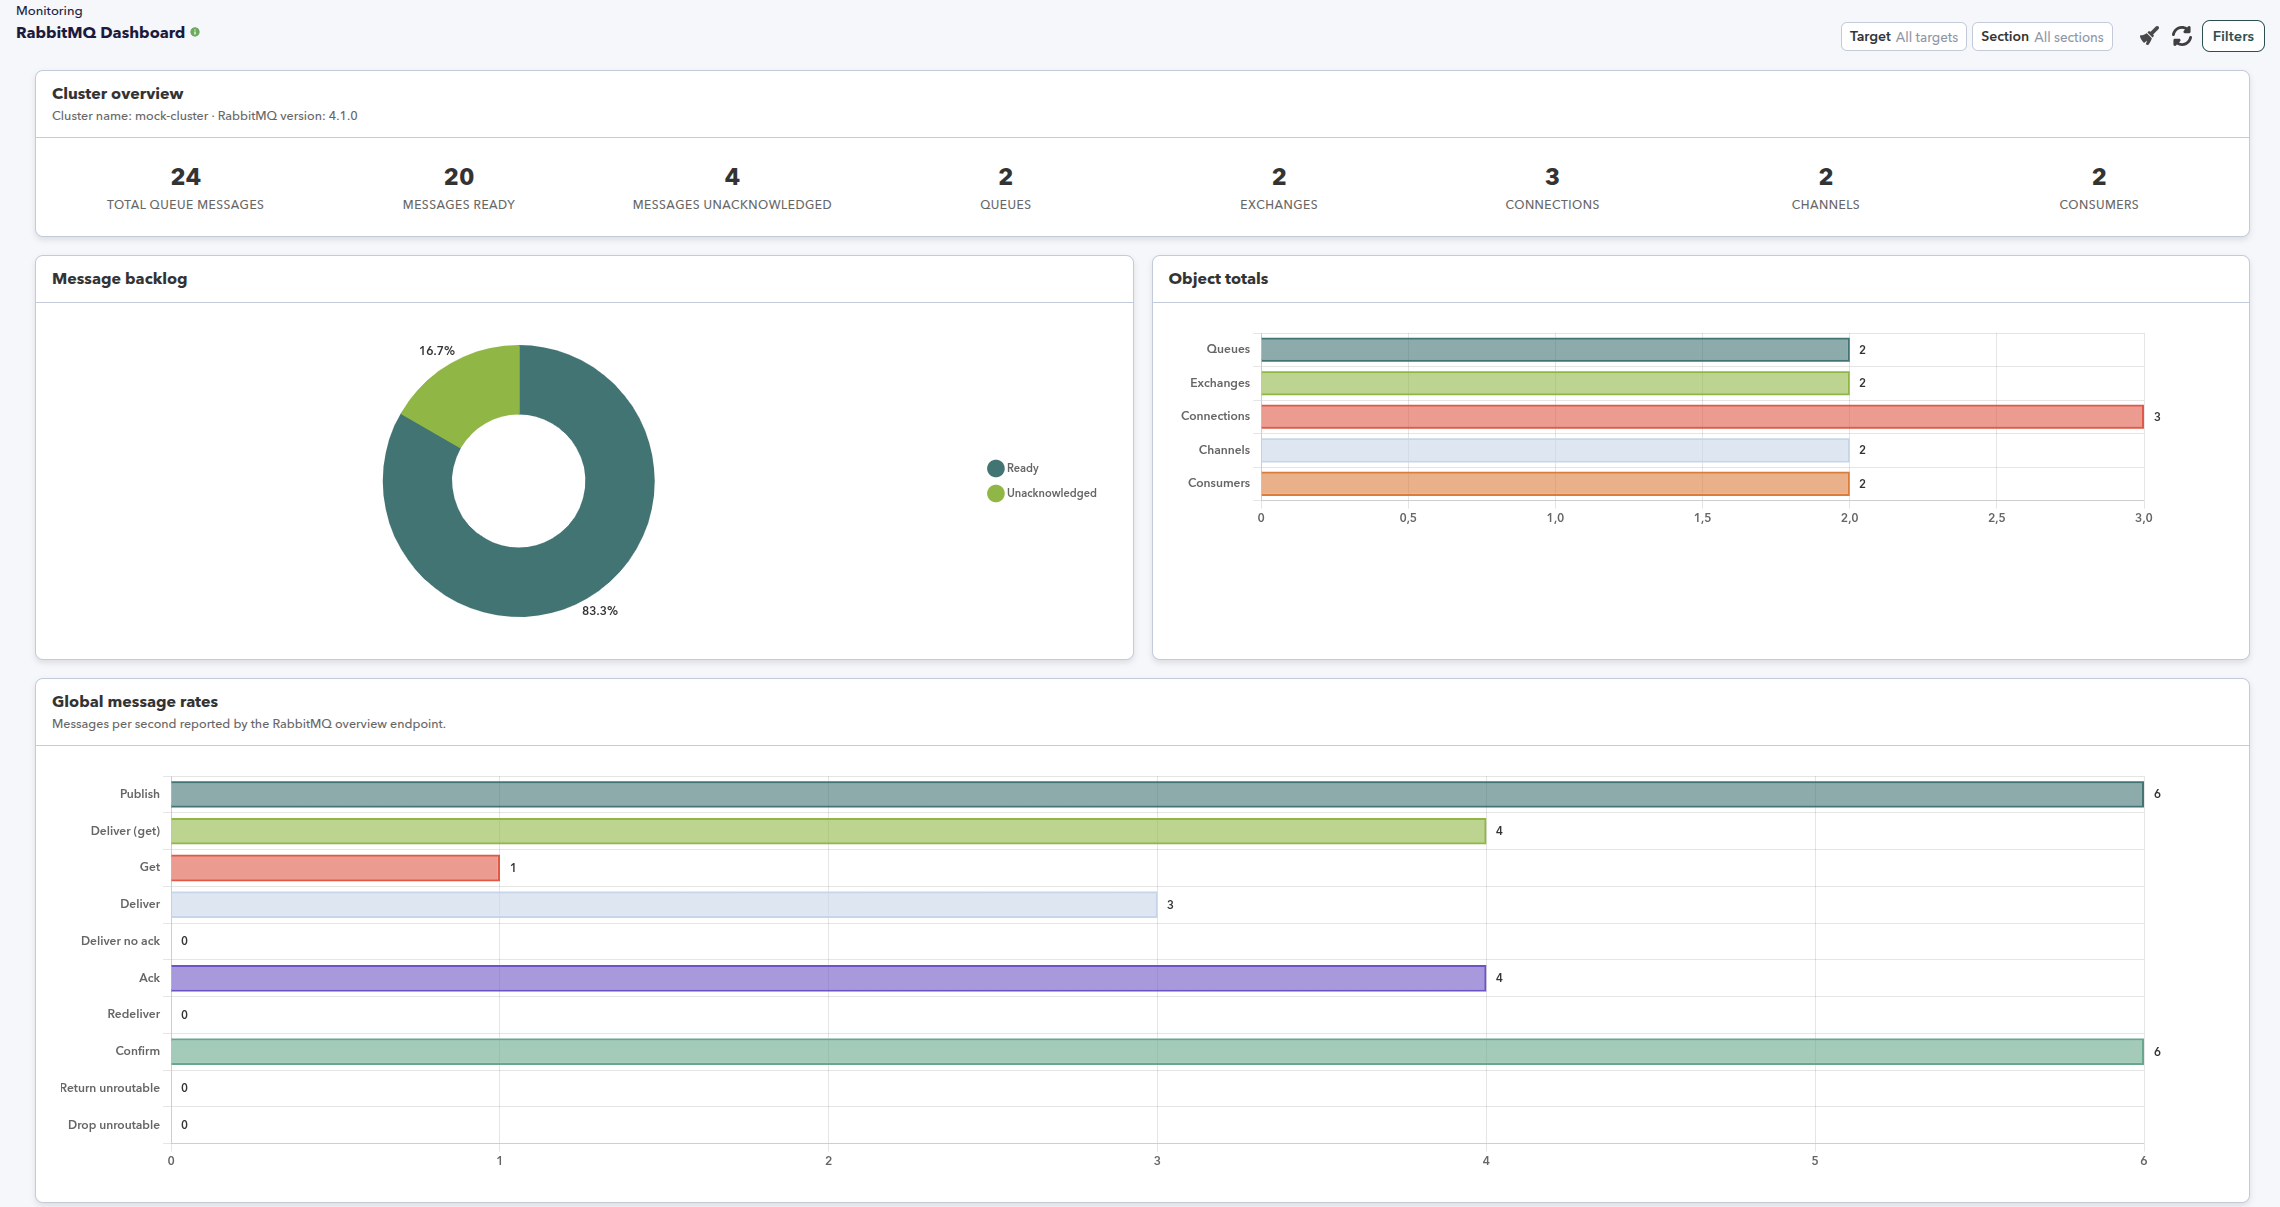
The dashboard is organised into sections. The cluster overview summarises the RabbitMQ version, the object totals and the message backlog of the monitored targets. A message rates section shows the global queue rates, and a nodes section lists the resources, limits and alarms of every cluster node. Dedicated sections describe the publish rates of exchanges, the states and network rates of connections, the backlog and consumers of queues, the activity of channels and the totals and rates of virtual hosts. A history section plots the evolution of the key counters over a selectable period.
A filter narrows the whole dashboard to one monitored target, one section and one time period. Sections whose modules were not created by the Discovery task are omitted, so a deployment that only collects the overview shows fewer panels. The dashboard formats numbers, byte sizes and durations, treats unknown module states as no data, and adapts to the light and dark console themes.
The extension does not create agents or modules, does not query RabbitMQ and does not change the monitoring configuration; it only presents data already stored in the console.
What it allows you to do
- Review the cluster overview, the object totals and the message backlog of every monitored RabbitMQ target in one console view.
- Follow the global queue message rates and the publish rates of the exchanges.
- Review node resources, limits and alarms, and the states and network rates of connections.
- Inspect queue backlog, ready and unacknowledged messages, consumers, memory and state, and the channel and virtual host figures.
- Filter the dashboard by target, section and period, and follow the evolution of the key counters in the history section.
What it monitors
- Cluster overview and object totals
- Global queue message rates
- Node resources, limits and alarms
- Exchange publish rates
- Connection states and network rates
- Queue backlog, consumers, memory and state
- Channel consumers and message rates
- Virtual host message totals and rates
How it works
The extension adds a RabbitMQ Dashboard entry to the Pandora FMS console status menu. When it is opened, it identifies the RabbitMQ agents created by the RabbitMQ Discovery plugin and reads the latest values and states of their modules from the console database. The values are grouped and presented as key figures, tables and charts, and the number, byte and duration figures are formatted for reading. A filter narrows the view to one target, one section and one period, and the history section plots the evolution of the key counters for that period. Sections whose modules were not created are omitted, and unknown or missing values are displayed as no data. The extension does not collect data; it presents what the monitoring already stores.
Benefits
- RabbitMQ cluster, node, queue and connection state become visible in one console view instead of across individual agents.
- Operators can compare message rates, backlog and resource usage across targets without building a report.
- Sections are shown only when the Discovery task created the matching modules, so the view stays aligned with the collected data.
- The dashboard follows the console theme and permissions, so it needs no separate access control or deployment.
Use cases
- Operations teams that watch the health and capacity of one or several RabbitMQ clusters through Pandora FMS.
- Teams that need one view of queue backlog, message rates and node resources after an incident.
- Environments where RabbitMQ is monitored alongside the rest of the infrastructure and the data is already collected by a Discovery task.
- Teams that want a consolidated read of the RabbitMQ entities without building a custom dashboard.
Requirements
- A Pandora FMS console where the extension is installed.
- The RabbitMQ Discovery plugin installed and a Discovery task that has created the RabbitMQ agents and modules.
- Agent read permission on the console for the user who opens the dashboard.
- No additional runtime; the extension runs inside the console.
Compatibility
Extension version 1.0. Runs inside the Pandora FMS console and presents the data collected by the RabbitMQ Discovery plugin. Compatible with Pandora FMS NG 784 and later, according to the Marketplace compatibility statement.
Limitations
- The dashboard only presents data already collected by the RabbitMQ Discovery plugin; it does not query RabbitMQ or collect metrics itself.
- Sections whose modules were not created by the Discovery task are not displayed.
- Agent detection relies on the identification written by the RabbitMQ Discovery plugin, so agents created outside that plugin are not listed.
- Modules in an unknown state are treated as no data, so their value is not shown.
- The history section only includes the key numeric counters collected as generic modules.
Tags
Categories
×
![]()
From this entry
Newest from same author
Newest in same categories
Newest with same tags
